Symbol Parameter Name Unit
Definition Comments
Illustrations
Ra
average roughness
µm
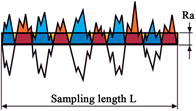
It is the average surface roughness of the scanned profile around the mean line (the least squares mean line or that generated by a standard filter). It represents the average absolute deviation of the scanned profile points from a mean line.
Rq
root mean squared
µm

It is the root mean square deviation of a scanned profile on a mean line. This is a statistically meaningful parameter that is only recently gaining acceptance for industrial surface measurement but is widely used within the optical surface community. This value is typically 11% higher than Ra.
It is further sensitive to peaks and valleys than Ra as the amplitudes are squared.
Profile roughness (2D): Rq/Ra = 1.22
Profile roughness (3D): Rq/Ra = 1.25
Rsk
skewness
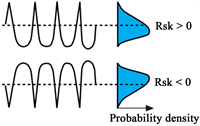
It is the roughness amplitude distribution and is a measure of the (a) symmetry processes produce near-Gaussian distributions, with a skewness value close to 0.0. For asymmetric height distribution, the skewness can be negative or positive values.
+ve for steep peaks and flat valleys.
−ve for flat peaks and steep valleys.
Rku
kurtosis
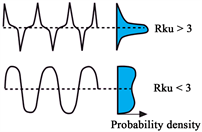
It is the roughness amplitude distribution and is a measure of the “peakedness” of the surface asperity heights about the profile mean line. A surface with a high kurtosis value tends to be peaky (large numbers of high asperities, and deep valleys) and produces a narrow asperity distribution.
True Gaussian distribution has a kurtosis = 3
Rk
core roughness depth
µm
The depth of the roughness core profile.
Rpk
reduced peak height
µm
The average height of protruding peaks above roughness core profile.
Rvk
reduced valley depth
µm
The average depth of valleys is projecting through roughness core profile.
Mr1
material portion 1
%
The level in %, determined for the intersection line which separates the protruding peaks from the roughness core profile.