Superordinate objective (category)
Extreme value analysis
Method
Nonstationary peaks over threshold
Description + literature
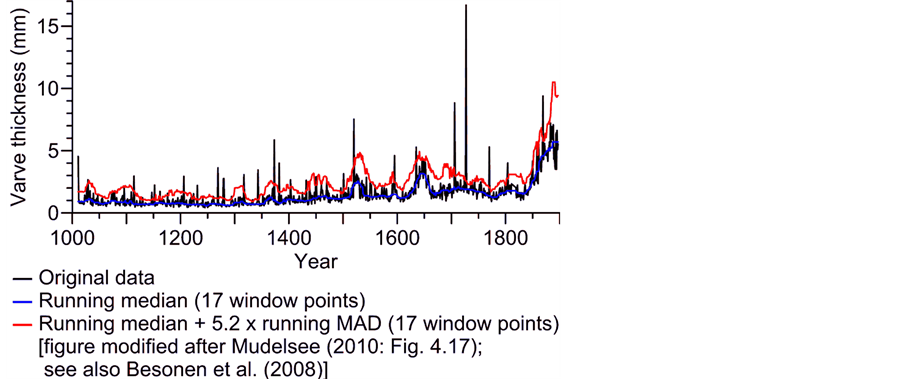
Selecting extremes in climatology may sometimes be done more realistically by allowing for a time-dependent “background”, on which a time-dependent variability acts. This nonstationary situation leads then naturally to a time-dependent threshold, in contrast to a stationary situation with a constant threshold.
The method should perform the estimation of the time-dependent background in a robust manner, that is, unaffected by the presence of the assumed extremes. Therefore you use the running median (calculated over the points inside a running window) for nonparametric background or trend estimation, and not the running mean. Analogously, you use the running median of absolute distances to the median (MAD), and not the running standard deviation for variability estimation. Cross-validation techniques offer a guide for selecting the number of window points by optimizing the tradeoff between bias and variance.
Mudelsee, M. (2006) CLIM-X-DETECT: A Fortran 90 program for robust detection of extremes against a time-dependent background in climate records. Computers and Geosciences 32:141-144.
Useful for (parameter, time resolution)
All parameters at any temporal resolution.
Note that high time resolution may result in a strong autocorrelation, which has to be considered in the selection of the number of window points (i.e., more window points have to be used compared to an autocorrelation-free situation).
Requirements for application
Homogeneity and representativeness of the data. In the case of autocorrelated data, the cross- validation guideline may be less informative and other numbers of window points have to be tried.
Result/interpretation
Sample for extreme value analysis (Generalized Pareto distribution, inhomogeneous Poisson process)
Assessment
The challenge of the nonstationary POT method consists in selecting the threshold and the number of window points. Cross-validation guides may help, but it is mandatory to “play” with the data and study the sensitivity of the results in dependence of the selected analysis parameters (threshold, number of window points).
Example/publication
The original paper (Mudelsee 2006) explains the method and describes the Fortran 90 software CLIM-X-DETECT. This analysis type has been applied to a number of climate change analyses, for example, on observed and modelled wildfires 1769-2100 (Girardin and Mudelsee, 2008) or hurricane proxy data 1000-1900 from a lake sediment core (Besonen et al., 2008).
Besonen, M.R., Bradley, R.S., Mudelsee, M., Abbott, M.B., Francus, P. (2008) A 1000-year, annually-resolved record of hurricane activity from Boston, Massachusetts. Geophysical Research Letters 35:L14705 (doi:10.1029/2008GL033950).
Girardin MP, Mudelsee M (2008) Past and future changes in Canadian boreal wildfire activity. Ecological Applications 18:391-406.
Mudelsee M (2010) Climate Time Series Analysis: Classical Statistical and Bootstrap Methods. Springer, Dordrecht, 474 pp.
Contact/project
Manfred Mudelsee
Climate Risk Analysis, Hannover, Germany;
mudelsee@climate-risk-analyis.com
www.climate-risk-analysis.com