2.3: why the slope of a line can be calculated using any two distinctive points on the line?
2.3 How would you help eighth graders understand that the slope of a non-vertical line can be calculated using any two distinct points on the line (e.g., the slope of the line below can be calculated with points P1 and P2 or points P3 and P4)?
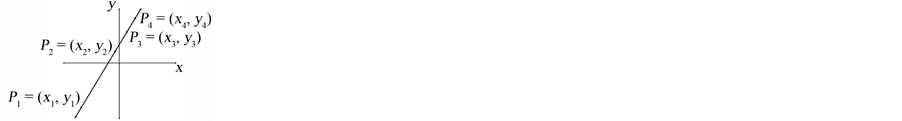
-Definition: Slope of a line;
-Independence of any two distinct points when calculating the slope;
-Similar triangles based on the angle-angle criterion.
2.4: What is the connection among different forms of linear equation?
2.4 Suppose you are teaching a class of ninth graders about graphs of linear equations in two variables. Explain how you would help students see the connection among:
・ the standard form ax + by = c where a, b, c are constants and a ≠ 0 or b ≠ 0
・ the slope-intercept form y = mx + k where m, k are constants
・ the point-slope formy?q = m(x ? p) where p, q are constants
・ the graph of a linear equation
-Connection between linear equation in two variables and its graph: (1) Definition of the graph: collection of all ordered pairs  that satisfy equation, ax + by = c; (2) The graph of a linear equation is a straight line; every straight line is the graph of some linear equation; (3) The slope of a line can be calculated using any two distinct points on the line. (note: facts (2) and (3) can be proved).
Quadratic Functions & Graphs
3.1: the graph of quadratic function
3.1 You and your colleagues are discussing struggles your 10th graders have in learning quadratic functions. As a group, you are trying to figure out how best to help students overcome the struggles. You decide that one approach is to help students “see” the connection between the quadratic function and its graph.
Let g and f be the quadratic functions g(x) = x2 and f(x) = ax2 + bx+ c where a, b, and c are constants and a ≠ 0. Describe how you would use the graph of g to help students see how one arrives at the graph of f.
-Definition of graph of a quadratic function;
-Graphs of all quadratic functions are similar to the graph of the unit quadratic function ; and graphs of all quadratic functions congruent to graph of some standard quadratic function of the form
  through translation (a fact that can be proved).
3.2: different forms of quadratic function
3.2 How would you help students understand that f(x) = ax2 + bx+ c can be re-written into the forms a(x − h)2 + k and a(x − p)(x − q) where h, k, p, and q are suitable constants and assuming the discriminant b2 − 4ac ≥ 0? How would you explain the relationship among the constants a, b, c, h, k, p, and q?
-Completing the square and why it’s central for learning quadratic functions;
-Definitions of: root of quadratic equation, zero of quadratic function;
-Relationship between roots and constants in each form of the quadratic function.
3.3, 3.4: Why do we need different forms of quadratic function?
3.3 After you introduce the three different forms of the quadratic function to your class, one student asks, “What’s the point of writing the same quadratic function into different forms?” Describe how you would respond to this student’s question.
3.4 How would you help students understand that each form of the quadratic function is useful for visualizing the graph of the quadratic function?
-Connection between different forms of the quadratic function and its graph and what information about a quadratic function each form reveals/hides: standard form indicates the quadratic function’s membership in the family of polynomial functions but provides little information about the graph; vertex form provides most information about the graph (vertex, axis of symmetry, translation rule from graph of  to
to  except for the x-intercepts; root form provides the x-intercepts but little else about the graph;
-Connection between the Quadratic Formula and finding the x-intercepts graphically (by using the fact that graphs of  and
and  are congruent by translation) and algebraically from the vertex form.